Graphviz最常使用的技能。
Graphviz介绍
看一下wiki关于Graphviz和dot的定义:
DOT语言是一种文本图形描述语言。它提供了一种简单的描述图形的方法,并且可以为人类和计算机程序所理解。DOT语言文件通常是具有.gv或是.dot的文件扩展名。很多程序都可以处理DOT文件。其中的一些,例如dot,neato,twopi,circo, fdp与sfdp,会读取DOT文件并将之渲染成为图形格式。其它的一些,比如gvpr,gc,accyclic,ccomps,sccmap和tred,可以读取DOT文件并对它代表>的图形进行一些处理。类似于GVedit,lefty,dotty和grappa则提供了交互式的界面。以上程序大部分都包括在了Graphviz软件包中。
对于程序员来讲,就会很方便的使用脚本来生成关于dot的图形描述文件,比如函数调用关系图。
Graphviz使用之节点(node)和线(edge)
Graphviz在画图时有两个基本组件——节点和联系节点的线。可以为这两种组件设置各种属性,比如颜色,形状等。更多的属性看这里;更多的颜色选择看这里;更多的节点形状看这里;更多的线的箭头看这里。
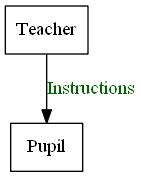
digraph node_and_edge{

    T [label="Teacher"]      // node T
    P [label="Pupil"]       // node P

    T->P [label="Instructions", fontcolor=darkgreen] // edge T->P
}

Graphviz使用之text下underline
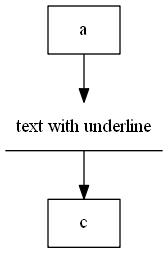
一般在画图时,会涉及到使用带有下画线的文字来说明这个图形的作用。
digraph graph_text_underline{
    a -> b;
    b -> c;
    b[shape=underline, label="text with underline"];
}

Graphviz使用之数据结构
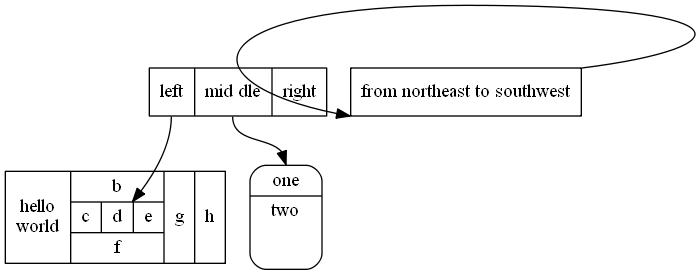
通常我们需要画数据结构,数据结构的各个部分需要放在一起,如下图所示:

    digraph structure {
      node[shape=record]
      struct1 [label="<f0> left|<f1> mid\ dle|<f2> right"];
      struct2 [label="{<f0> one|<f1> two\n\n\n}" shape=Mrecord];
      struct3 [label="hello\nworld |{ b node[shape=record]|{c|<here> d|e}| f}| g | h"];
      struct1:f1 -> struct2:f0;
      struct1:f0 -> struct3:here;

      node1[shape=box, label="from northeast to southwest"];
      node1:ne -> node1:sw;
    }
<f0>表示port,用于线的连接。比如下面的struct1:f1 -> struct2:f0表示从struct1的f1位置处连接到struct2的f0处。
还有就是节点的位置,有n(north), e(east), w(west), s(south), es, en, nw, sw。
更复杂的结构,比如表,可以在lable中使用HTMLString,即在label中使用html标签来表示。
Graphviz使用之子图
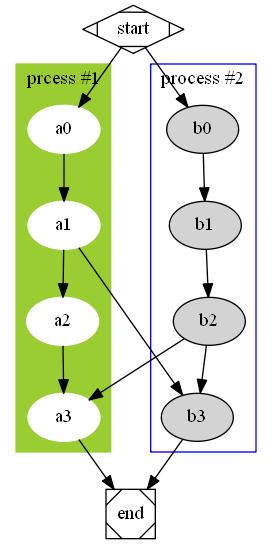
子图必须要以cluster开头,否则Graphviz不认识。
digraph subgraph {
	subgraph cluster0 {
		//我是一个子图,subgraph定义了我,
		node[style = filled, color = white];
		//我之内的节点都是这种样式
		style = filled;
		//我的样式是填充
		color = lightgrey;
		//我的颜色
		a0->a1->a2->a3;
		label = "prcess #1"
		//我的标题
	}

	subgraph cluster1 {
		//我也是一个子图
		node[style = filled];
		b0->b1->b2->b3;
		label = "process #2";
		color = blue;
	}

	//定义完毕之后,下面还是连接了
	start->a0;
	start->b0;
	a1->b3;
	b2->a3;
	a3->end;
	b3->end;

	start[shape=Mdiamond];
	end[shape=Msquare];
}

